
Class in Session
I’ll be the first to admit that there are several aspects of life where I really let my nerd show. Personal finance has rapidly become one of those and I especially enjoy formulating and applying spreadsheets to the tasks of managing finances.
Here and there I will do a post about a particular spreadsheet that I’ve found useful and describe how I put it together and why. Also, for those that subscriber to the blog (I promise not to fill up your inbox!), you will get an email with links to template versions of the spreadsheets that I use.
The Original
The first spreadsheet that I did for my personal finance journey was one that I originally call ‘Financial Projection’. This was a little bit of a misleading title since it was a bit more focused on tracking outstanding debts and projecting the year-end balances on those debts.
I’ve made some enhancements over the past couple of years, but I still use this sheet today.
The Layout
The spreadsheet contains multiple sheets with one sheet representing each year.
Each sheet uses the columns to represent months in the year. There are fourteen columns for data. The first data column at the beginning of the sheet shows the previous year-end balances for each debt. The last columns shows the year-end balances for the current year.
![]()
At the top of the sheet there are some rows for meta-data. The top row shows the month and the row below it contains the number of days in that month. The only update made here is for February on leap years.
The next two rows show the total outstanding debt at the beginning of the month and the percentage of debt that has been paid down so far this year.
![]()
These are sums based on the next set of rows which contain the details for each outstanding debt.
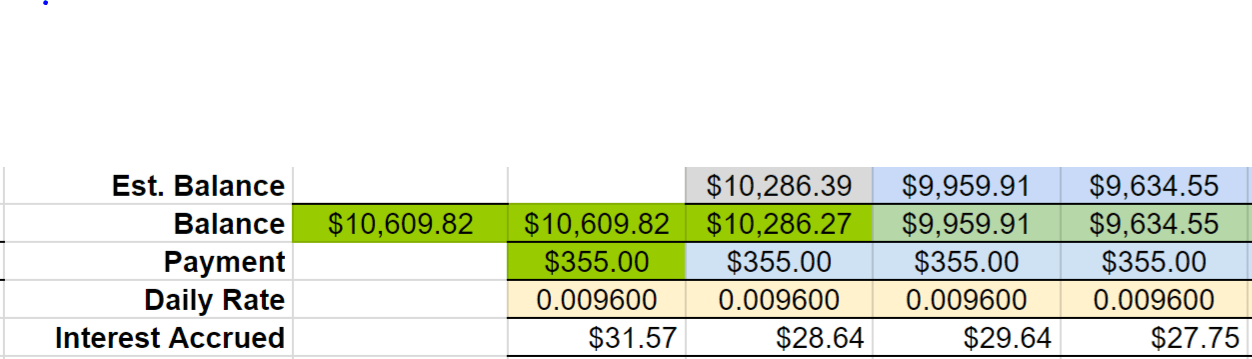
The Debt Section
Each outstanding debt in the spreadsheet consists of five rows. I used the top row to show the projected balance for the beginning of the month (I have noticed that there are sometimes slight variances between my projected balance and the statement balance but I haven’t spent any time tracking down the difference).
The next row contains the statement balance for that month. This is a value that I manually enter when I go to pay the bill.
The third row is for the payment amount. Here is where I manually record the amount of money put toward the debt.
The fourth column contains the daily interest rate for the debt. Not all loans calculate interest daily, but this is used to give me a rough idea of how much money I’m losing by having the debt each month.
The daily interest rate is used to calculate the amount of interest accrued for the month. This can be a rather eye-opening figure for some items.
Finally, I subtract the payment amount from the statement balance and add back the accrued interest. This is the value that gets put in the next month’s projected balance box.
Putting it Together
Once I have all of my debts added to the sheet, I use the statement balance from each debt and add them all together to arrive at the total outstanding debt value at the top of the sheet.
The percentage of reduction sheet is calculated by dividing that month’s total debt by the beginning of the year total debt and then subtracting the result from 1.
Since the calculations are all cascading and update when the row values are changed, I am able to project my year-end total outstanding debt and year-end debt reduction percentage.

I’ve thought about adding some fancy graphs for a more visual look at the data, but I haven’t gotten motivated to do it yet. Besides, I also have the Personal Capital dashboard for visual reference.
It really helped me to see how much progress I was making and the amount of interest that each debt was costing me. Hopefully a tool like this will help you too. If you’d like a copy of the template, subscribe to the blog.
Cheers!
-cb3